 01simulation
Why the lift goes the wrong way
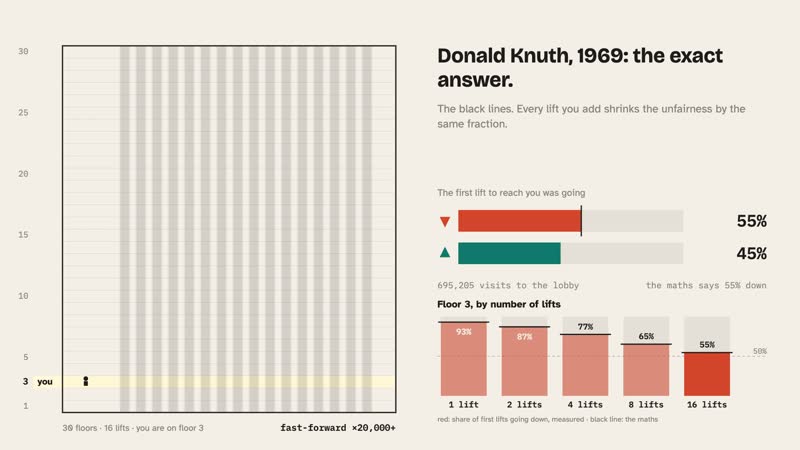
From floor 3 of a 30-floor tower, the first lift to arrive is going down 93% of the time. Your wait for one going up is the same on every floor.
15 films · 14 live pages
Short films about everyday puzzles and slow changes, where nothing on screen is an illustration. Either a working simulation is running and the numbers are measured from it as you watch, or real open data is shown exactly as it was recorded. Every film has a page here where you can run the same thing yourself.
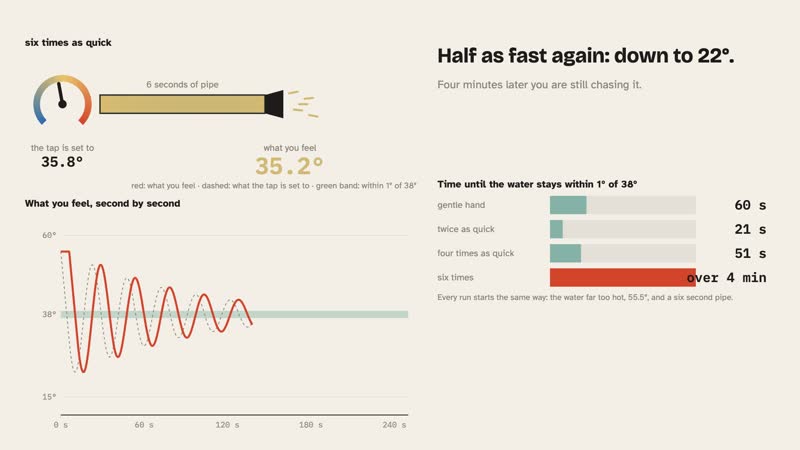
The water takes six seconds to reach you. Make the hand quicker and watch what a delay does.
What this is
Explainer videos usually ask you to trust the narrator and enjoy the animation. These films are built the other way round: the picture is the evidence, and the voice only tells you where to look.
If a claim can be run, it should not have to be believed.
Why it is made this way
The narration is an AI voice, and every film says so. A generated voice has no reputation to stake, so the trust has to come from somewhere else. Here it comes from the picture: a model you can run, or data you can look up.
Surprising results deserve a way to check them. That 45% of people in a supermarket queue are overtaken by someone who arrived later, or that the earliest sunset comes a week before the shortest day, sounds like something a video would make up. So each film ships with the thing itself.
Limits are part of the result. Every film ends with what the model leaves out or what the data cannot show. A number without its limits is an advertisement.
How a film is made
The script is written last but one, from numbers that already exist. That order is the whole method.
A simulation starts as a short list of rules in one file. A real-data film starts with a public source that anyone can download.
The model is run against a result that is known for certain. If they disagree, the model is wrong and nothing is filmed.
Long runs produce the figures. For real data, a script counts pixels, readings or earthquakes and writes down the method.
Only now is there a narration, and every figure in it comes from step three. The voice is generated; the words are checked against the measurements.
The film is the same page, stepped frame by frame, with the numbers computed again as it plays. Even the sound is calculated from the film's own events.
Each film closes on its limits, and each live page lists every rule. Where a spoken line turned out slightly off, the screen shows the measured figure.
The films
Each card opens the live page: the same model or the same data as the film, with the controls handed to you.
01simulationFrom floor 3 of a 30-floor tower, the first lift to arrive is going down 93% of the time. Your wait for one going up is the same on every floor.
 02real data
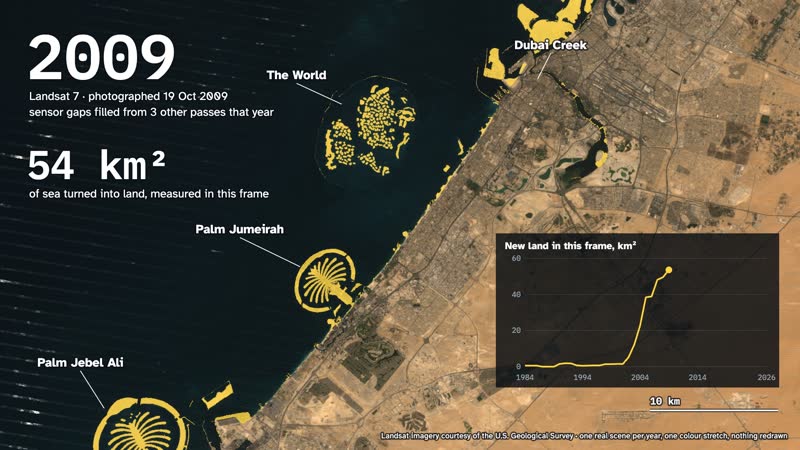
One satellite photograph a year. About 54 km² of sea became land, nearly all of it between 2002 and 2009.
 03simulation
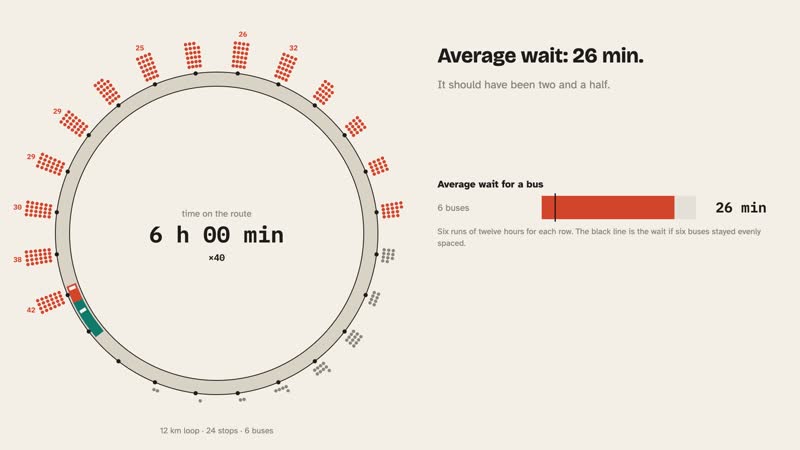
Six evenly spaced buses collapse into one convoy by themselves. Doubling the fleet barely helps. One small rule does.
 04real data
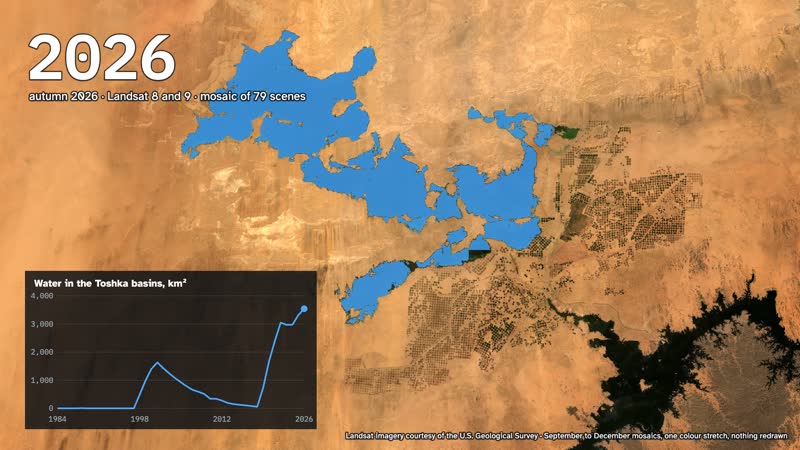
No water for 14 years, 1,630 km² of lakes by 2001, almost dry by 2018, and over 3,500 km² in 2026.
 05simulation
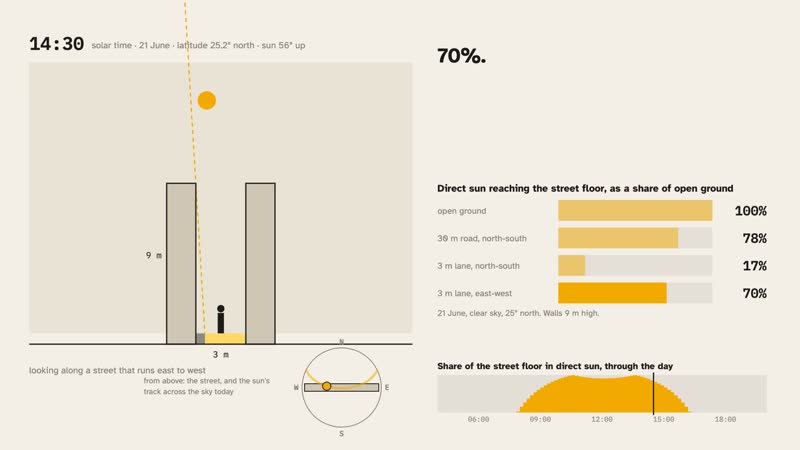
In June at 25° north, a 3 m lane takes 17% of the open-ground sun running north to south, and 70% running east to west.
 06real data
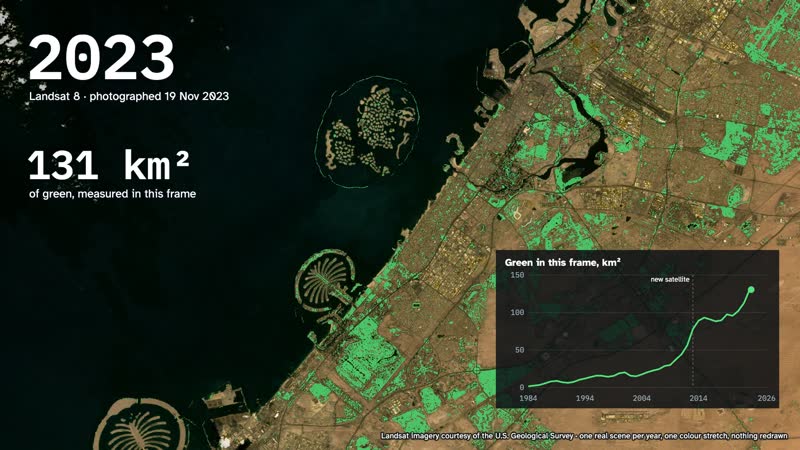
The same photographs, counted for plants: about 2 km² of green in 1984, over 100 now.
 07simulation
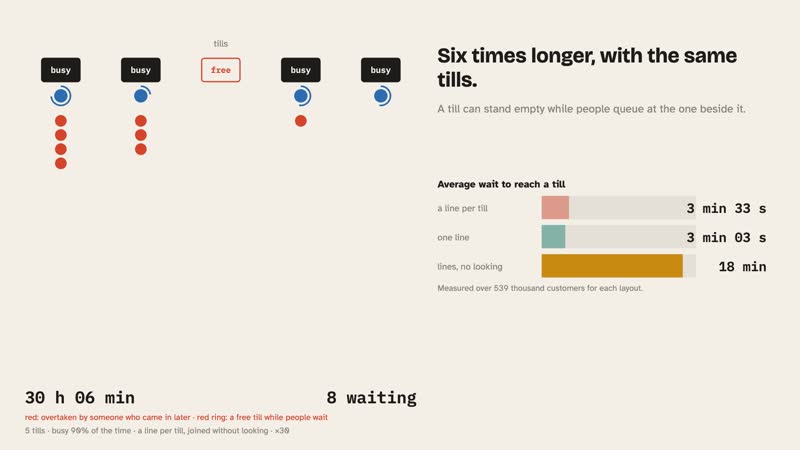
With a line at every till, 45% of customers are overtaken by someone who came in later. With one line, nobody is.
 08real data
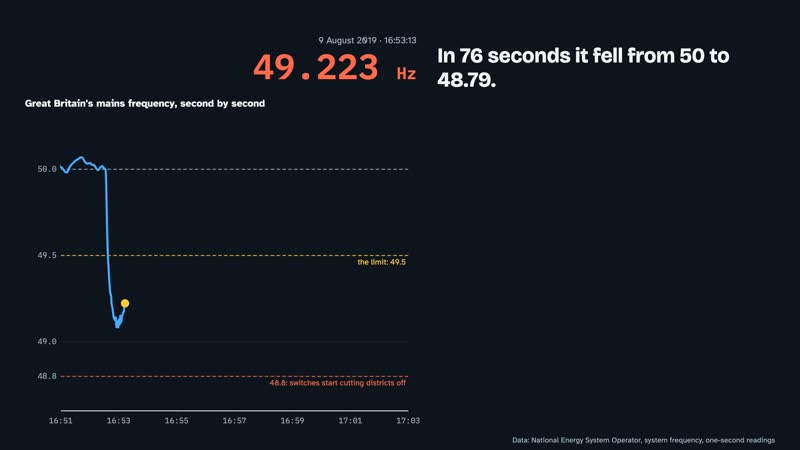
Great Britain's mains sat on exactly 50 hertz for about an hour in a month. In 2019 it fell to 48.79 in 76 seconds.
 09simulation
The water answers six seconds late, so a quicker hand settles slower. Past one speed it never settles.
 10real data
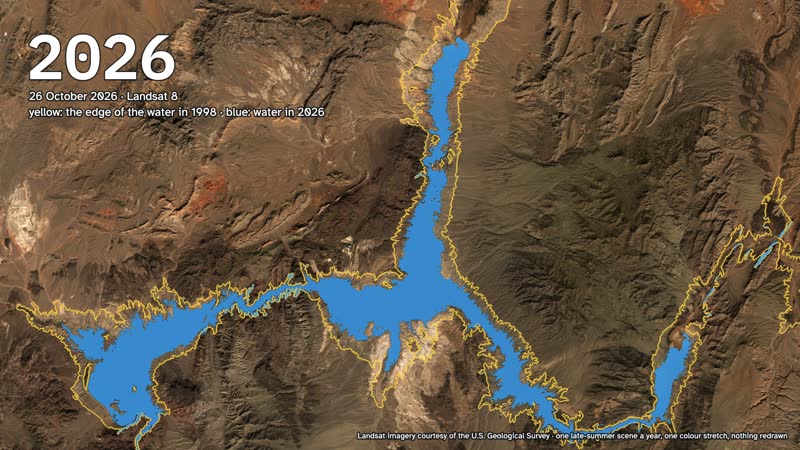
About 536 km² of water in this frame in 1998. 270 in October 2026, the lowest of 43 photographs.
 11simulation
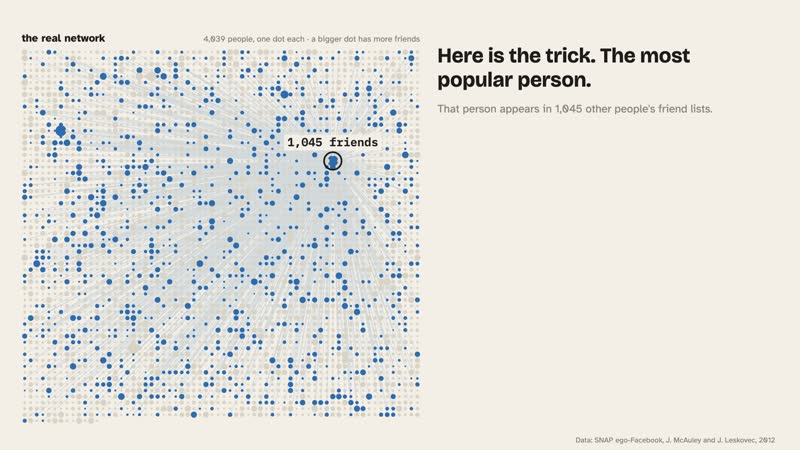
In a real network of 4,039 people, 87.5% have fewer friends than their friends do. It is about who gets counted.
 12real data
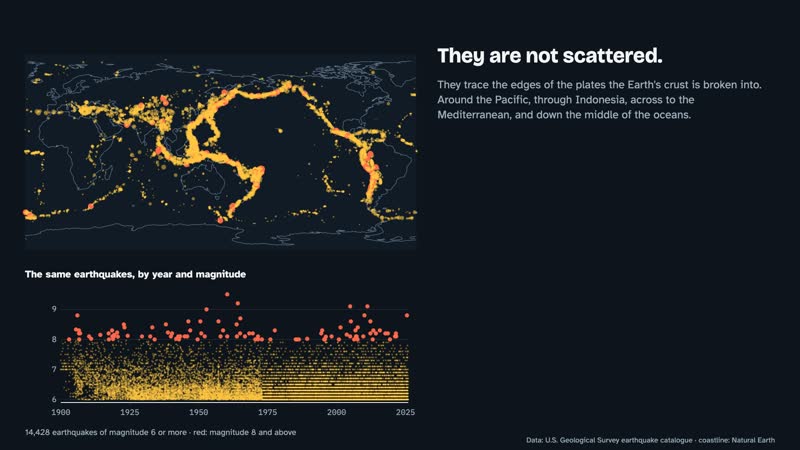
Every step down in magnitude has about ten times as many. Where the line bends is what the instruments cannot hear.
 13simulation
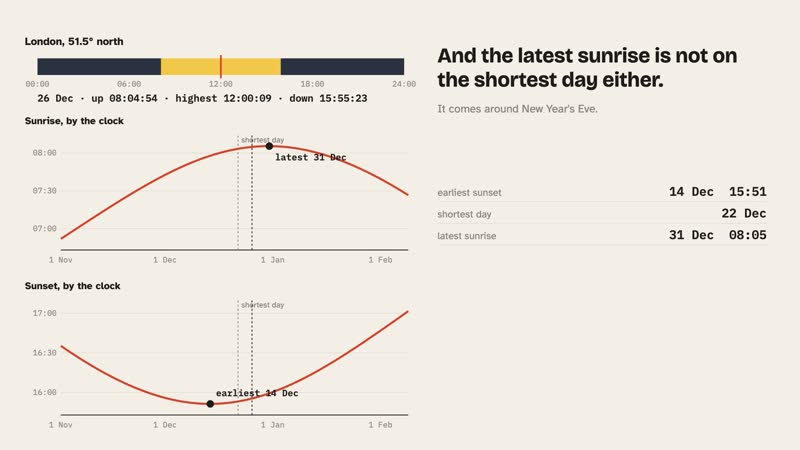
In London the earliest sunset and the latest sunrise are 17 days apart. In Singapore, 101.
 14real data
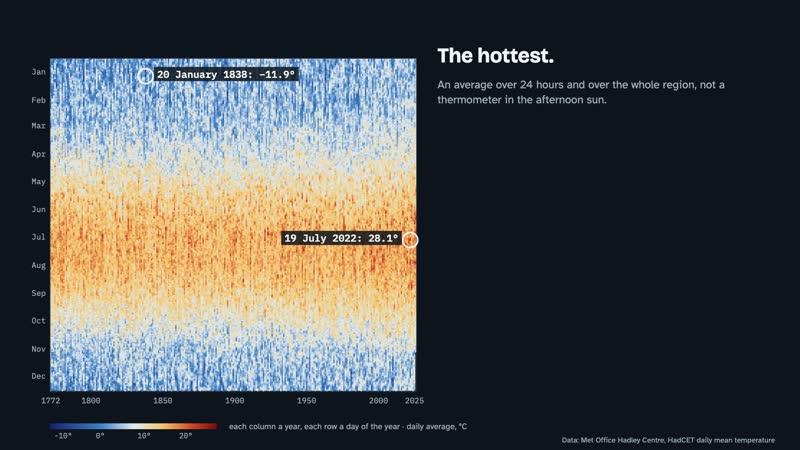
Every day in central England since 1772. The ten warmest years are all since 2006.
 15simulation
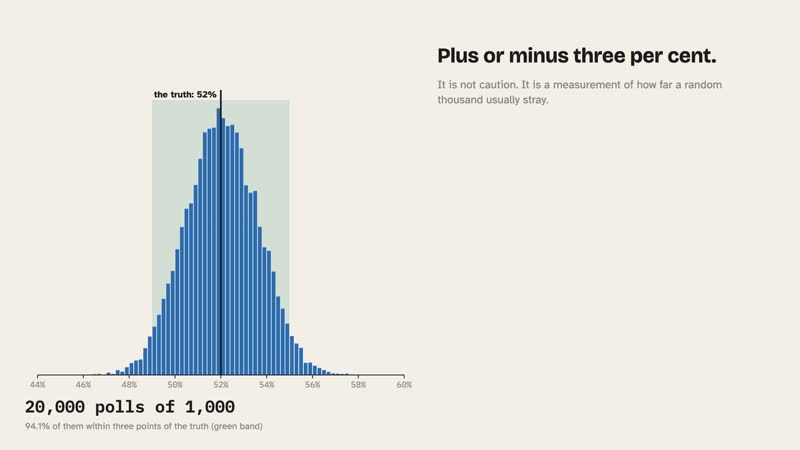
A random thousand is within three points 94% of the time. Tilt who answers, and a bigger poll gets surer of the wrong winner.
Watch
Three to six minutes each, with chapters. Every description links back to its live page here.
In plain terms
Narration is an AI voice reading a written script. The pictures and numbers are not generated: they are computed or recorded.
A lift with no passengers, buses that never fill up. Simple enough to check, and the films say what a real system adds.
Satellite areas are good to a few per cent. Where a year is cloudy or an instrument changed, the film marks it.
A temperature record or a shrinking lake is shown as measured. Causes are outside what the picture can prove.
Sources